
|
Land Retirement Demonstration Project |
|
LRDP Home | Land Retirement | Habitat Restoration Study | Valley Flora Propagation Center | Restoration Research | Data and Links | ESRP Home |
|
Habitat Restoration StudiesOverviewIn order to determine the responses of wildlife to land retirement and restoration efforts, the Biological Opinion for the LRDP (FWS 1999) required that a five-year Habitat Restoration Study (HRS) be conducted. Specific objectives of the HRS were to:
To accomplish these goals, a large-scale (323.75 ha; 800 ac) study was initiated at the Tranquillity site in 1999. In 2000, a sister study was established at the Atwell Island site. |
|
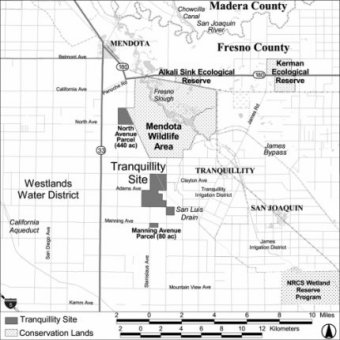
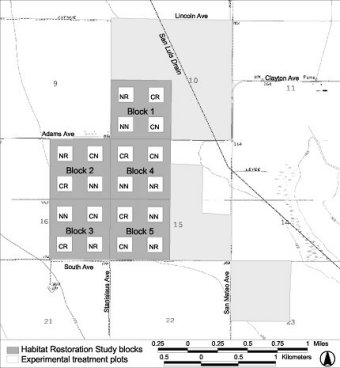
Tranquillity HRSIntroductionIn 1999, a 323.75 ha (800 ac) Habitat Restoration Study (HRS) was established on retired agricultural lands at the Tranquillity study area (Figure 1), in order to examine the responses of wildlife to restoration efforts. The study incorporated a complete randomized block design, and consisted of twenty, 4.05-hectare (10 ac) study plots arrayed in 5 blocks (Figure 2). The size of the HRS was determined by that which could be reasonably manipulated and monitored with a high degree of experimental rigor, but which was sufficient to yield significant results in a relatively short amount of time (i.e., the five-year monitoring period). Two restoration factors were studied: 1) the introduction of native plants through seeding (imprinting) and transplanting; and, 2) the re-establishment of surface contouring (i.e., microtography). Four combinations of these treatment factors were applied (Figure 2). |
Annual MonitoringBiotic MonitoringEach year, 32 surveys were conducted of the biota on the Tranquillity site. The majority of surveys were specific to the HRS plots (Table 1); however, a number of site-wide surveys were also conducted (Table 2). The effort required to conduct these surveys was quite variable, with some (e.g., the vegetation contaminants monitoring) generally requiring only a couple of person-days to complete. Others, such as the small mammal trapping, required up to 20 person-days (e.g., five biologists for four days). Physical Impacts MonitoringMonitoring of physical conditions at the Tranquillity site was designed to address the potential for selenium contamination of the local biota. Soil-monitoring was aimed at detecting changes in levels of soil selenium, boron, and salinity that might result from land retirement over the 5-year life of the Demonstration Project. The initial surveys conducted in September and October of 1999 established baseline values for soil chemistry including salinity, selenium, boron, nitrate, ph and major anions, cations and nutrients. Soil sampling methodologies were as follows. A rectangular sampling grid was established and land surface soil sampling was conducted at 124 locations. Soils were collected from a depth of 0 to 30.5 cm (0 to 1 ft) at each corner of the HRS plot using a shovel. In addition, sampling of soils from 0 to 30.5 cm (0 to 1 ft), 60.9 to 91.4 cm (2 to 3 ft), and 121.9 to 152.4 cm (4 to 5 ft) was performed in the center of each plot, and from an additional six locations per plot, using a 10.1 cm (4 in) inside diameter split barrel core sampler driven to a depth of 152.4 cm (5 ft). Groundwater monitoring was instituted in July of 1998 to detect the subsurface level of water and test the hypothesis that the water level would decline in the absence of surface watering (i.e. the irrigation of crops). Monitoring entailed collecting samples from 27 wells and sumps on the Tranquillity site. |
|
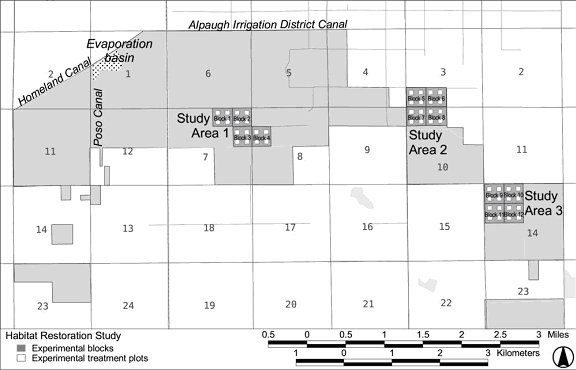
Atwell Island HRSIntroductionThe Habitat Restoration Study at Atwell Island was originally envisioned as a single study area, similar in design to its sister study in Tranquillity but comprised of sixteen ca. 0.8 ha (2 ac) plots. Later, the decision was made to increase the number of plots to 48, with these arrayed in three, spatially disjunct groupings of 16 plots (Figure 3). Data from both the pre-project inventory (April 2000; Selmon et al. 2001) and from the first year's monitoring of the plots (Uptain et al 2002) were analyzed as if these three areas constituted a single study area. As the vegetation on the plots developed, and as data analysis proceeded, it became increasingly obvious that the three areas were tremendously heterogeneous. Differences among the areas were sufficiently pronounced to preclude any meaningful analyses of the vegetation data (i.e., blocking effects would have obscured any treatment effects). Therefore, each of the three areas is now considered to constitute a single study area; with each study area containing four blocks (replicates) of four plots Figure 3). |
|
|
As with the Tranquillity HRS, barley was sown on the three study areas in the year prior to plot installation. The barley was irrigated as needed during the growing season, with Study Area 1 flood-irrigated and the other two areas sprinkler irrigated. In December 2001, the plots were disked and microtopographic contours (berms) were installed. Berms (Figure XXX) were constructed in a similar fashion to those at the Tranquillity HRS site (Uptain et al 2002); however, only forty-nine berms were installed on each plot at Atwell Island. By contrast, the larger (10-acre) plots at Tranquillity each had 240 berms. Monitoring on the Atwell Island HRS plots followed a similar schedule as for the Tranquillity HRS (see: Table 1 and Table 2). Comprehensive reports detailing the activities and findings of research and other activities at both the Tranquillity and Atwell Island sites have been prepared and submitted at approximately annual intervals. Electronic copies of these reports can be accessed online here. |
Table 1. Annual monitoring activities on the Habitat Restoration Study plots (Tranquillity site), 1999-2003, with the number of times each survey was conducted annually.
| Survey | Annual Repetitions |
|---|---|
| Avian Survey | 4 |
| Avian Nesting Survey | 1 |
| Spring Vegetation Monitoring | 1 |
| Fall Shrub Monitoring | 1 |
| Invertebrate Pitfall Survey | 1 |
| Invertebrate Sweep Survey | 1 |
| Photographic Stations Survey | 4 |
| Reptile and Amphibian Coverboard Survey | 1 |
| Reptile and Amphibian Transect Survey | 1 |
| Small Mammal Pitfall surveys | 1 |
| Small Mammal Trapping | 4 |
Table 2. Annual site-wide monitoring activities at the Tranquillity site, 1999-2003, with the number of times each survey was conducted per year.
| Survey | Annual Repetitions |
|---|---|
| Invertebrate Contaminants Monitoring | 1 |
| Small mammal Contaminants Monitoring | 1 |
| Spotlighting Survey | 4 |
| Track Station Survey | 4 |
| Vegetation Contaminants Monitoring | 1 |
| Winter Raptor Survey | 1 |
References
Selmon, M., P. Kelly and C. Uptain. 2000. Land Retirement Demonstration Project.1999 Annual Report. Endangered Species Recovery Program, Fresno, Ca. 84 pp. + appendices.
Uptain, C. E., K. Dulik, P. Brandy, M. Selmon, P. A. Kelly, D. F. Williams, S. L. Lee and J. Brummer. 2001. Land Retirement Demonstration Project Year Two. 2000 Annual Report. Endangered Species Recovery Program, Fresno, CA. 124 pp.
Uptain, C. E., N. P. Ritter, S. L. Lee, S. A. Laymon, K. E. Kreitinger, S. E. Phillips, A. C. Harpster, A. J. Kokx, A. J. Howard, S. R. Messer, D. P. Newman, S. W. Deal, P. A. Kelly and D. F. Williams. 2002. Land Retirement Demonstration Project Year Three. 2001 Annual Report. Endangered Species Recovery Program, Fresno, CA. 151 pp.
U.S. Fish and Wildlife Service. 1999. Biological Opinion formal section 7 consultation for the Central Valley Project Improvement Act Land Retirement Program Demonstration Project. Reference No. 1-1-99-0125. Sacramento, CA. 64 pp.
Page created: January 5, 2005; Last updated: March 30, 2006